CluedIn Performance Metrics
Introduction
Conceptually, you can think of CluedIn as a Streaming platform with multiple persistence stores. It just so happens that CluedIn also ships with a lot of functionality to integrate, manipulate, govern and steward this data on its way to downstream consumers.
With this in mind, the question of how long does it take to process data from an input to its output arises. Naturally, it strongly depends on many factors, including:
- The number of CPU cores assigned to processing.
- The amount of RAM assigned to processing.
- The complexity and size of the data being processed.
- What CluedIn features you are running on the processing pipeline (we will assume you are using all features)
To provide some baselines and benchmarks, we will introduce some datasets coming from different types of platforms that speak to the complexity and size of data.
CluedIn utilises an Enterprise Service Bus to queue the incoming data. This data is then monitored by many different “workers”. These “workers” are in-memory .net core processes that take a record at a time and run it through 100’s of validations, automated cleaners and more. The reason to explain this, is that, in its raw form, the Enterprise Service Bus can process incoming messages very fast, it is the 100’s of validations and automated processors that will (for example) take this rate from 30,000 messagess to 1000 messages per second i.e. the more the system automates, the slower it can process the data.
CluedIn scales both vertically and horizontally, meaning that you can increase the speed of processing by either using bigger machines or more machines. Due to the stateless nature of the processing components of CluedIn, it means that you can have 0 processing services or 100 running.
Although CluedIn can technically run using 1 CPU core, it is not optimal for any real workloads within CluedIn. The amount of CPU Cores and RAM that you assign to processing services is all set in your Helm charts. Within Kuberenets you will still need to allocate enough in your Node Pools to be able to scale your processing servers.
Let’s start to talk about the data itself. We will typically talk about simple data vs complex data in CluedIn. Simple data is data that uses as little of the 100’s of inbuilt services as possible i.e. less work, means quicker processing. Good examples of simple data usually comes in the form of well structured and small records such as rows in a table or JSON/XML from a REST service. Complex data usually will come in the form of Physical files or large records in tables or JSON/XML packages. We refer to it as complex data due to the fact that it will be enabling a lot of the inbuilt processing functions and require their attention.
NOTE: It has to be mentioned that you should still think about whether you need to bring in all columns in all tables from all sources. It is a hard question to answer, as it may be that the data you do not bring in, was the exact data you needed in a particular situation. What should be remembered is that you can always bring this data in later without the need for complex remodelling.
There are many ways to monitor the performance of your processing pipeline, one of which is exposed to Administrators with the CluedIn User Interface itself. The Engine Room will give you a breakdown of the overall speed of the processing pipeline and then a zoom in on each processing pipeline step to show the rate of each step.
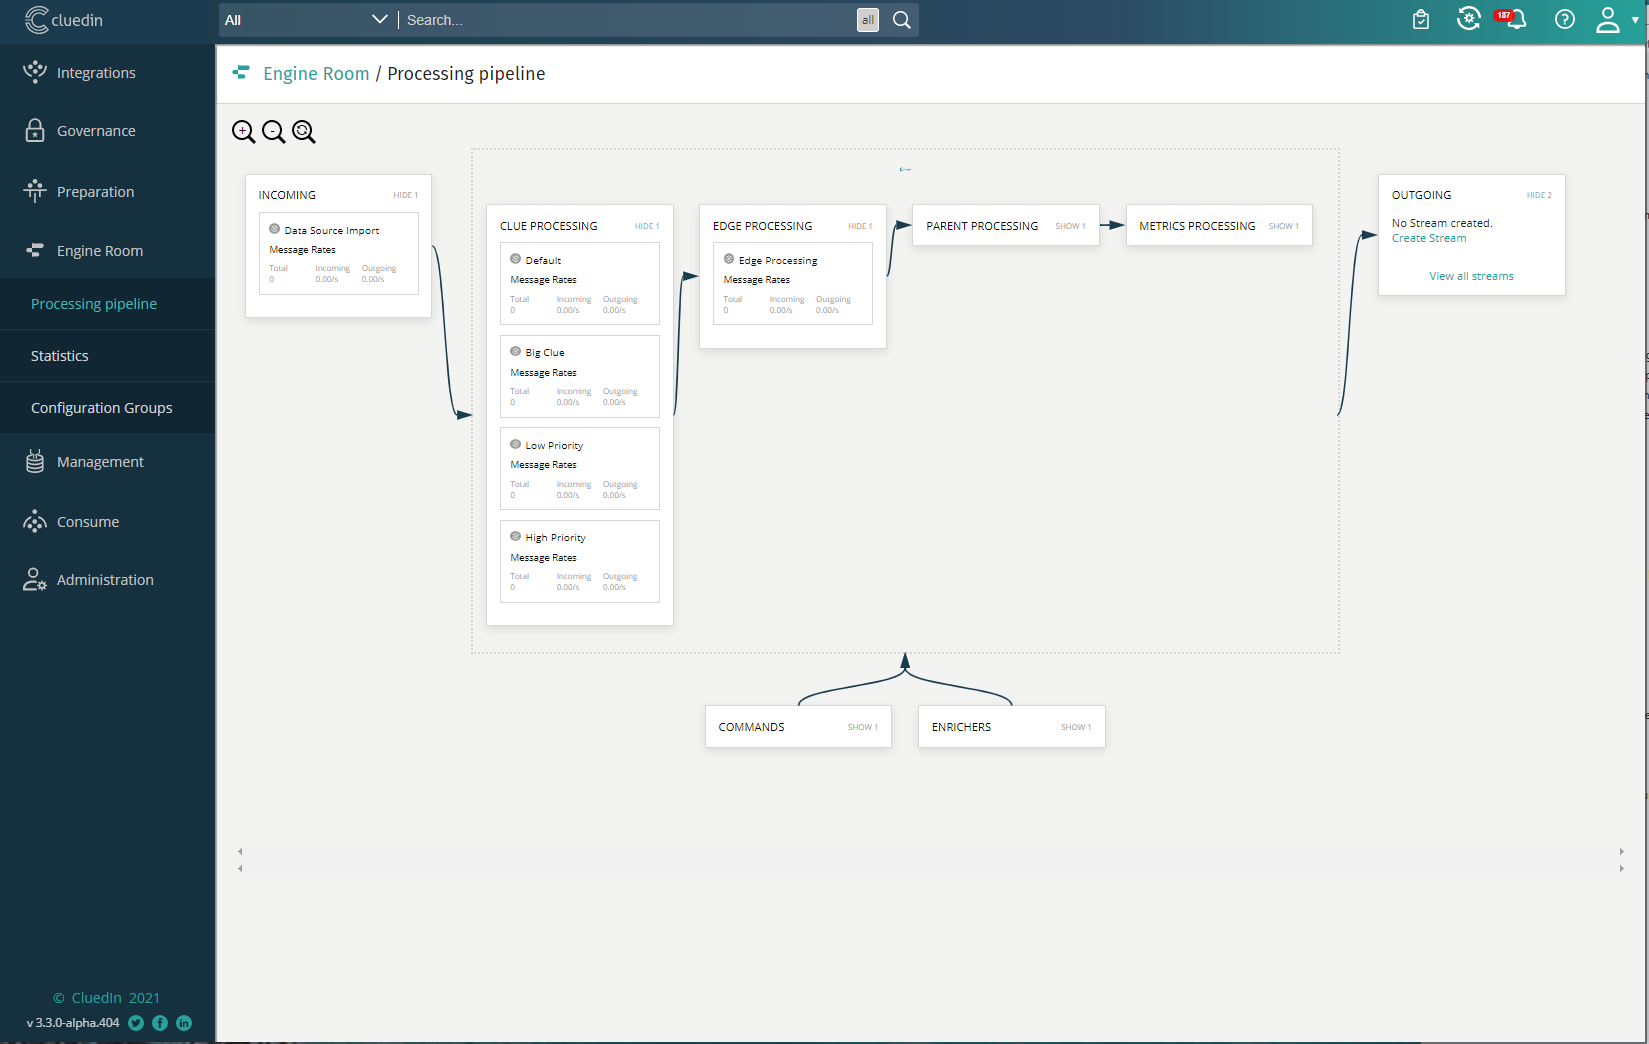
This also gives you the idea that you can turn different processing pipelines if you want to. For example, if you are not wanting some of the more “expensive” processing pipeline steps then these can be disabled through configuration.