---
title: Monitoring
url: https://documentation.cluedin.net/ingest/troubleshooting/monitoring
content_type: how-to
section: Ingest > Troubleshoot ingestion
---
# Monitoring
> how-to: Steps to accomplish one task.
In this article, you will learn about the features on the **Monitoring** tab to gain insight into what is happening with your records and help you quickly identify issues.
## Common monitoring elements
Regardless of the data source type—file, ingestion endpoint, or database—the **Monitoring** tab in the data set includes the following sections:
- **Total** – here you can view general information about the records from the current data set, including the total number of records, original columns, mapped columns, and records in quarantine. This is a useful tool to compare the number of original columns and mapped columns.

- **Global queues** – here you can view global statistics on ingestion and processing requests from all data sets. This is a useful tool to ensure that the system runs correctly.
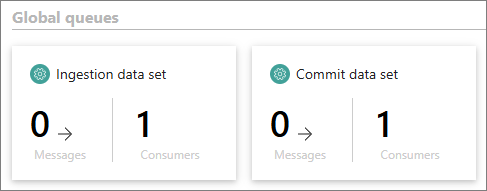
- **Data set queues** – here you can view statistics on the records in the current data set during different stages of their life cycle (loading, mapping, processing).

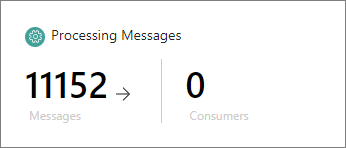
If the number of messages of any type is greater than 0 while the number of consumers is 0, there may be an issue with your data. The following screenshot illustrates a situation where troubleshooting is needed to fix the processing of records.
To get better visibility into what is happening with your records, in addition to monitoring, use **system healthchecks**. You can find them in the upper-right corner of CluedIn.
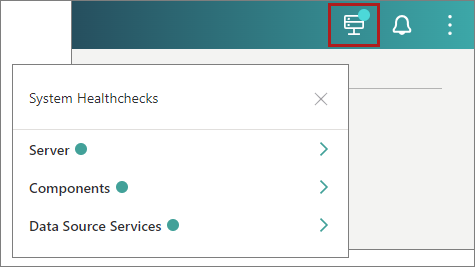
If the status of any item is red or orange, it means that something is wrong, and some services probably need to be restarted. To fix the problem, contact the person responsible for maintaining CluedIn for your organization (for example, system administrator) who can restart the needed service.
The following table provides the description of each queue and corresponding troubleshooting guidelines. If the number of messages doesn't return to 0 or if the number of consumers remains 0, refer to the **Troubleshooting** column for recommended actions.
| Queue | Description | Troubleshooting |
|--|--|--|
| Ingestion data set | Messages representing JSON objects sent to various endpoints. | If you are a system administrator, restart the pod named "datasource-processing". |
| Commit data set | Messages representing requests for data set processing. Messages can be added by selecting the **Process** button on the **Process** tab of the data set or each time the endpoint receives data with the auto-submission enabled. | If you are a system administrator, restart the pod named "datasource-processing". |
| Submitting Messages | Messages containing JSON objects sent to the mapping service to be converted into records during processing. | Go to the **Process** tab and select **Cancel**. If you are a system administrator, verify the status of the mapping service and restart the pod named "annotation". |
| Processing Messages | Messages containing records sent to the processing pipeline. | If you are a system administrator, restart the pod named "submitter". |
| Quarantine Messages | Messages containing records that were approved on the **Quarantine** tab and sent to the processing pipeline. | If you are a system administrator, restart the pod named "submitter". |
| Loading Failures | Messages containing records from the data set that cannot be fully loaded. | Go to the **Preview** tab and select **Retry**. |
| Error Processing Messages | Messages containing records that could not be processed by the processing pipeline because it does not respond. | Go to the **Process** tab and select **Retry**. If you are a system administrator, verify the status of processing pods. |
## Monitoring for ingestion endpoints
In a data set created from an ingestion endpoint, the **Monitoring** tab consists of three areas:
- [Overview](#overview)
- [Ingestion reports](#ingestion-reports)
- [Ingestion anomalies](#ingestion-anomalies)
### Overview
The **Overview** area contains general statistics about the records and queues described in [Common monitoring elements](#common-monitoring-elements).
### Ingestion reports
The **Ingestion reposts** area contains information about each request sent to the specific ingestion endpoint in CluedIn. This information is presented in a table that consists of the following columns:
- **ReceiptID** – unique identifier of a request. Each request you send to an ingestion endpoint in CluedIn, whether successful or not, has a unique receipt ID.
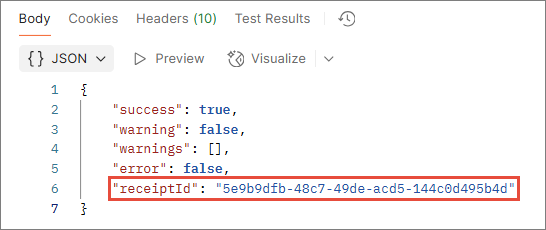
This ID allows you to quickly locate the request report in CluedIn. Simply copy the receipt ID from the request response and paste it to the search box above the table.
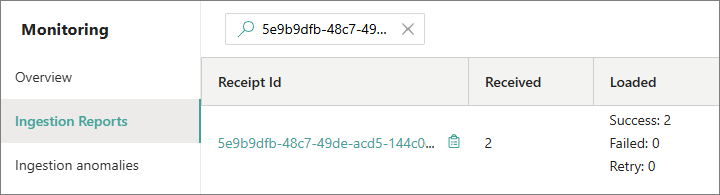
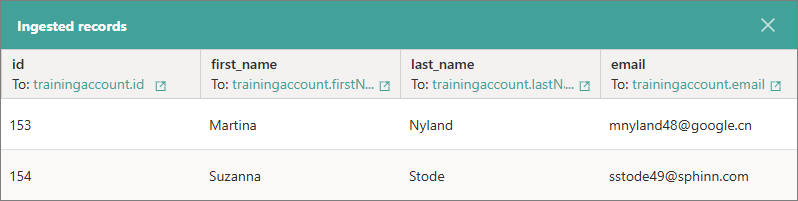
To view the records that were sent to CluedIn in that specific request, select the receipt ID. As a result, the records appear in the **Ingested records** pane.
Alternatively, you can copy the receipt ID, go to the **Preview** tab, paste the receipt ID in the search box, and start to search. As a result, only the records sent in a specific request will be displayed on the page.
- **Received** – the number of records received by CluedIn. If the number is 0, it means that the request contained errors and CluedIn rejected it.
- **Loaded** – the number of records loaded into CluedIn. This column contains three categories:
- **Success** – the number of records that were successfully loaded into CluedIn.
- **Failed** – the number of records that failed to load into CluedIn.
- **Retry** – the number of records that attempted to reload into CluedIn.
- **Logs** – the number of logs generated for a specific request. You can view the log details by selecting the content of the cell. Keep in mind that for ingestion endpoints, we only log warnings. These logs are the same as those found on the **Logs** tab of the dataset. The difference is that the **Logs** tab contains logs for all requests, while the **Ingestion reports** table provides logs for each specific request. For more information on how to read logs, see the [Logs](https://documentation.cluedin.net/ingest/troubleshooting/logs.md) documentation.
- **Processed** – the number of times the records from a specific request have been processed in CluedIn.
- **Created at** – the timestamp indicating when the ingestion report was generated. This corresponds to the time when the HTTP request was executed.
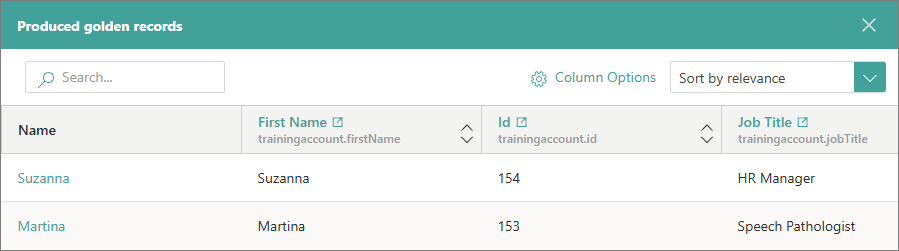
- **Produced golden records** – the golden records generated from a specific request or those to which records from the request were aggregated as data parts. To view a list of golden records produced from a specific request, select **View ingested records**. As a result, the golden records appear in the **Produced golden records** pane.
- **Actions** – currently, this column provides the possibility to remove records—golden records or data parts that were aggregated to the existing golden records—produced from a specific request. If you want to remove the records produced from a specific request, select **Remove records**. In the confirmation dialog, you can select the checkbox to remove the source records from the temporary storage on the **Preview** tab. To confirm your choice, enter _DELETE_, and then start the removal process.
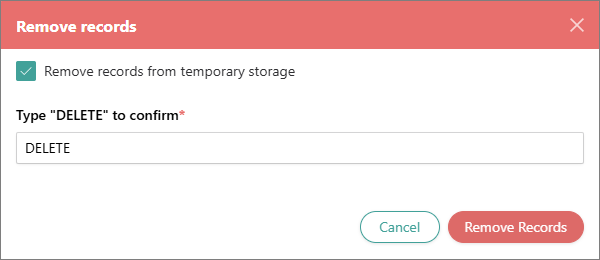
Once the records are removed, they will no longer be displayed when you select **View ingested records** for a specific request. The records removal mechanism is similar to the one described in [Remove records](https://documentation.cluedin.net/ingest/processing/remove-records.md), with the difference being that the article describes removing all records produced from the data set, while you have the option to remove records produced from a specific request that contributes to the data set.
### Ingestion anomalies
The **Ingestion anomalies** area contains a list of potential errors that can occur with the data set, along with remediation steps and the status for each error. This area provides a quick and easy way to monitor the data set for any problems, ensuring you have complete visibility. If you notice that the status of any error indicates a problem, refer to the remediation steps.
The following table contains the list of errors and remediation steps. You can find a similar table on the **Monitoring** tab in CluedIn.
| Error name | Remediation |
|--|--|
| **Error in logs**
This can occur due to various elements, generally data-related. For example, an invalid field name in the record or an unsupported value for a given data type. | Go to the **Logs** tab and filter the logs by the **Error** level. Then, select a log to view the detailed reason for the error. |
| **Loading failure**
This can occur when the search databases are under heavy load. | Go to the **Preview** tab. You should see the **Retry** button there. Select the **Retry** button to attempt reloading your records. If this does not resolve the issue, please reach out to our support team. |
| **Error in submissions**
This can occur when the CluedIn processing pipeline is under intense load and cannot handle all the incoming requests. | Go to the **Process** tab. You should see the **Retry** button for the submission in the **Error** state. Select the **Retry** button to attempt processing your records. If this does not resolve the issue, please reach out to our support team. |
| **Ingestion consumer lost**
Ingestion consumer is used to ingest any payload sent to CluedIn. If the ingestion consumer is lost, it means that CluedIn will not ingest any new records. | CluedIn has a self-healing mechanism that checks if a consumer exists for a queue every 5 minutes. If a consumer is lost, the administrator will receive a notification. |
| **Process consumer lost**
Process consumer is used to process any payload sent to CluedIn. If the process consumer is lost, it means that CluedIn will not process any new records. | CluedIn has a self-healing mechanism that checks if a consumer exists for a queue every 5 minutes. If a consumer is lost, the administrator will receive a notification. |
| **Commit consumer lost**
Commit consumer is used to map any payload sent to CluedIn. If the commit consumer is lost, it means that CluedIn will not map any new records. | CluedIn has a self-healing mechanism that checks if a consumer exists for a queue every 5 minutes. If a consumer is lost, the administrator will receive a notification. |
| **Submission consumer lost**
Submission consumer is used to send records to the processing pipeline. If the submission consumer is lost, it means that CluedIn will not send records to processing, and they will not become golden records. | CluedIn has a self-healing mechanism that checks if a consumer exists for a queue every 5 minutes. If a consumer is lost, the administrator will receive a notification. |
| **Quarantine consumer lost**
Quarantine consumer is used to send records to quarantine. If the quarantine consumer is lost, it means that CluedIn will not send any records to quarantine. | CluedIn has a self-healing mechanism that checks if a consumer exists for a queue every 5 minutes. If a consumer is lost, the administrator will receive a notification. |
| **Submissions stuck**
This can occur either because some messages were manually deleted or because the cluster is down. | If you encounter this error, please reach out to our support team. |
Up: [Troubleshoot ingestion](https://documentation.cluedin.net/ingest/troubleshooting.md)