

Plan the ingestion
concept Explains how something works
On this page
| Audience | Time to read |
|---|---|
| Data Engineer, Data Analyst | 3 min |
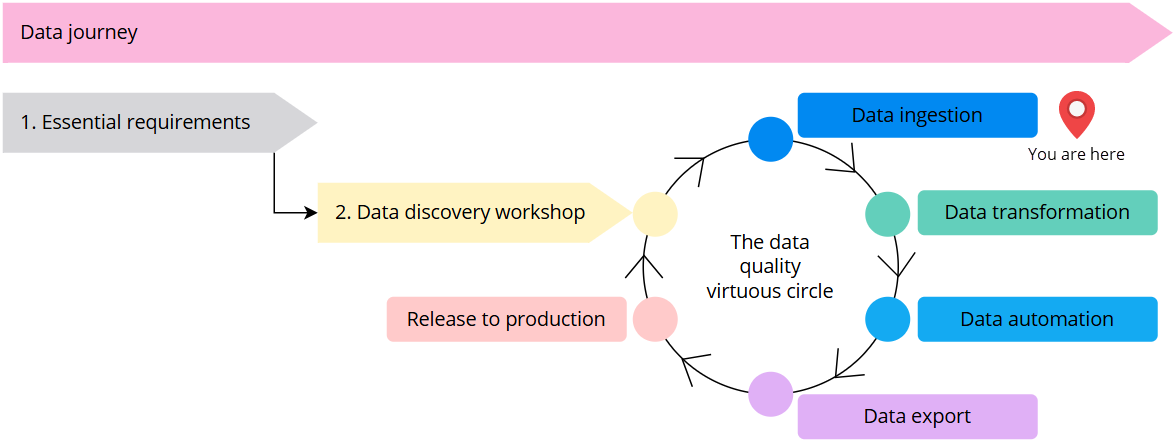
You are here in the data journey
Before you start
-
Make sure you have conducted the data impact workshop to understand what sources you want to use first.
-
Make sure you are familiar with the available tools for data ingestion and have picked the right tool for your use case.
Now that you have prepared a list of sources and selected a tool for data ingestion, you can start the actual data ingestion process. This process consists of three steps—ingest, map, and process. In this article, we’ll focus on the first step to get your data into CluedIn.

While ingesting your data, remember one of our project principles—start small. The idea is to focus on one end-to-end data flow, and not to load 10 million records at once as this will become a burden in the development phase of your project.
Data ingestion instructions
In the following table, you’ll find links to video trainings and documentation for each data ingestion tool. Follow the steps for your tool of choice to get your data into CluedIn.
| Tool | Link to documentation |
|---|---|
| File | Link to training video and documentation. |
| Endpoint | Link to training video and documentation. |
| Database | Link to documentation. |
| Azure Data Factory | Link to training video. |
| Microsoft Fabric/Azure Databricks | Link to documentation. |
| Microsoft Purview | Link to documentation. |
| Crawler | Link to documentation. |
Data ingestion limitations
The current public release of CluedIn does not support nested data and will flatten nested objects. Depending on the structure of your nested data, the current flattening approach might be suitable. However, in some cases, you might need to process the nested object in a separate data set. We are currently working on the support of nested objects in the future.
Structure of ingested data
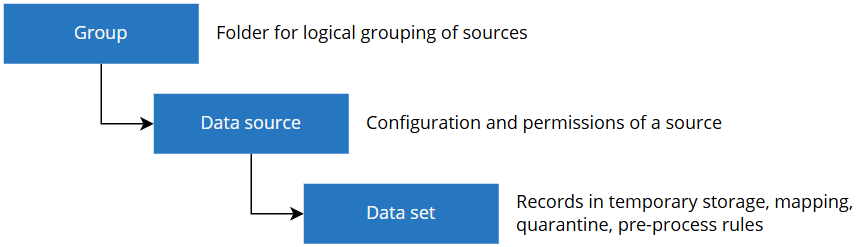
When the data is ingested into CluedIn, it will be represented in the following structure.
-
Group – this is a folder to organize your sources in a logical form.
-
Data source – this is an object that contains the necessary information on how to connect to the source (if applicable), as well as the users and roles that have permissions to the source. Think of it like a database in SQL Server.
-
Data set – this is the actual data obtained from the source. The data set contains unprocessed records, mapping information, quarantine capabilities, and rules applied to your raw records. Think of it like a table in a SQL Server database.
Data ingestion results
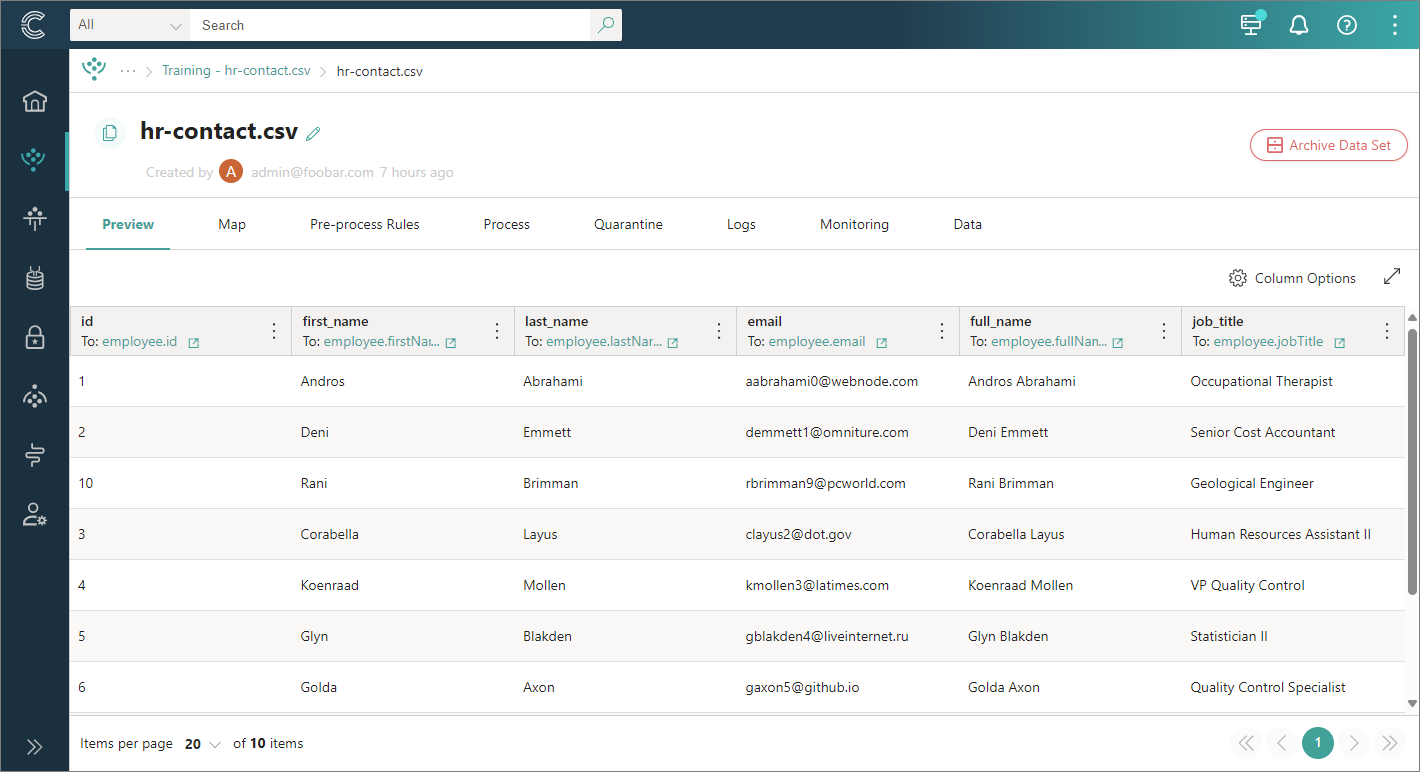
If you followed our instructions, you should see the result similar to the following.
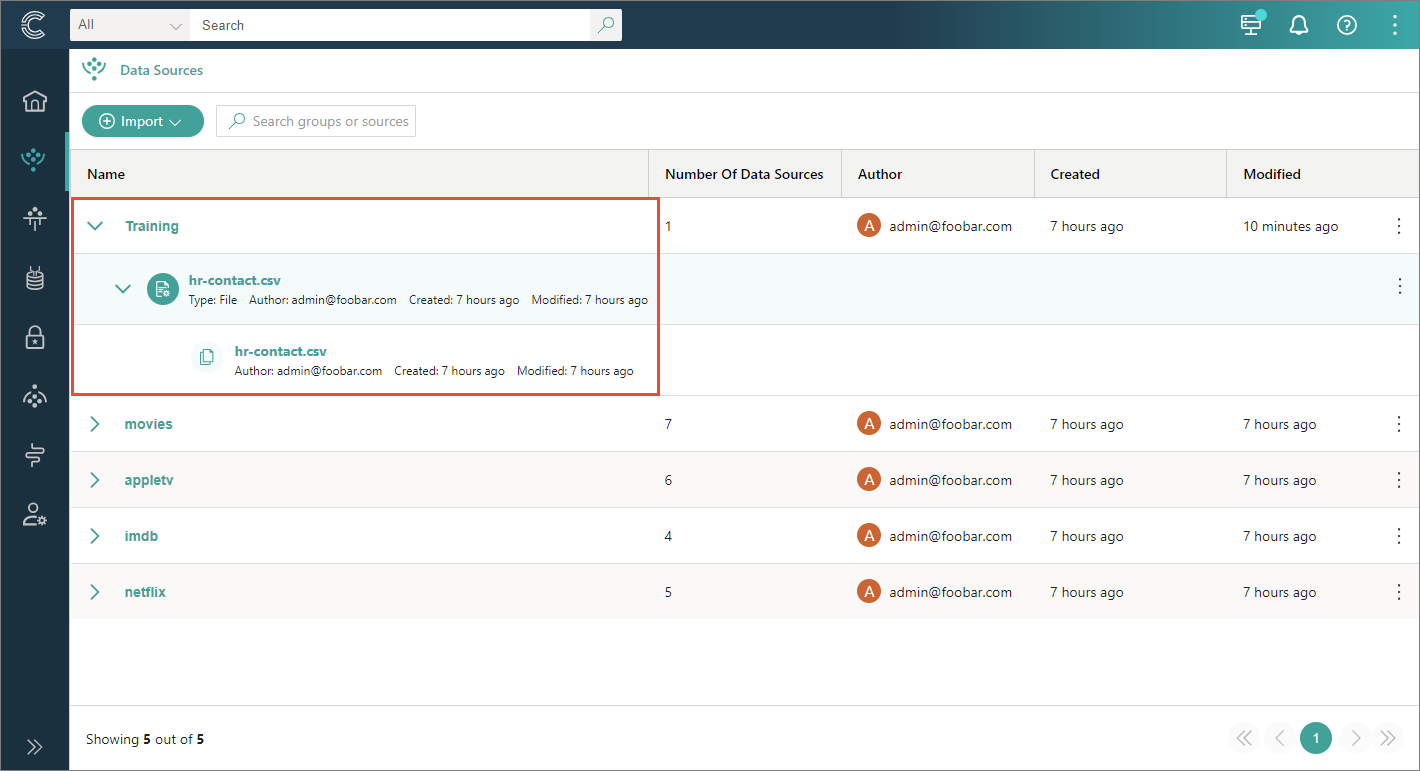
Data source containing data sets
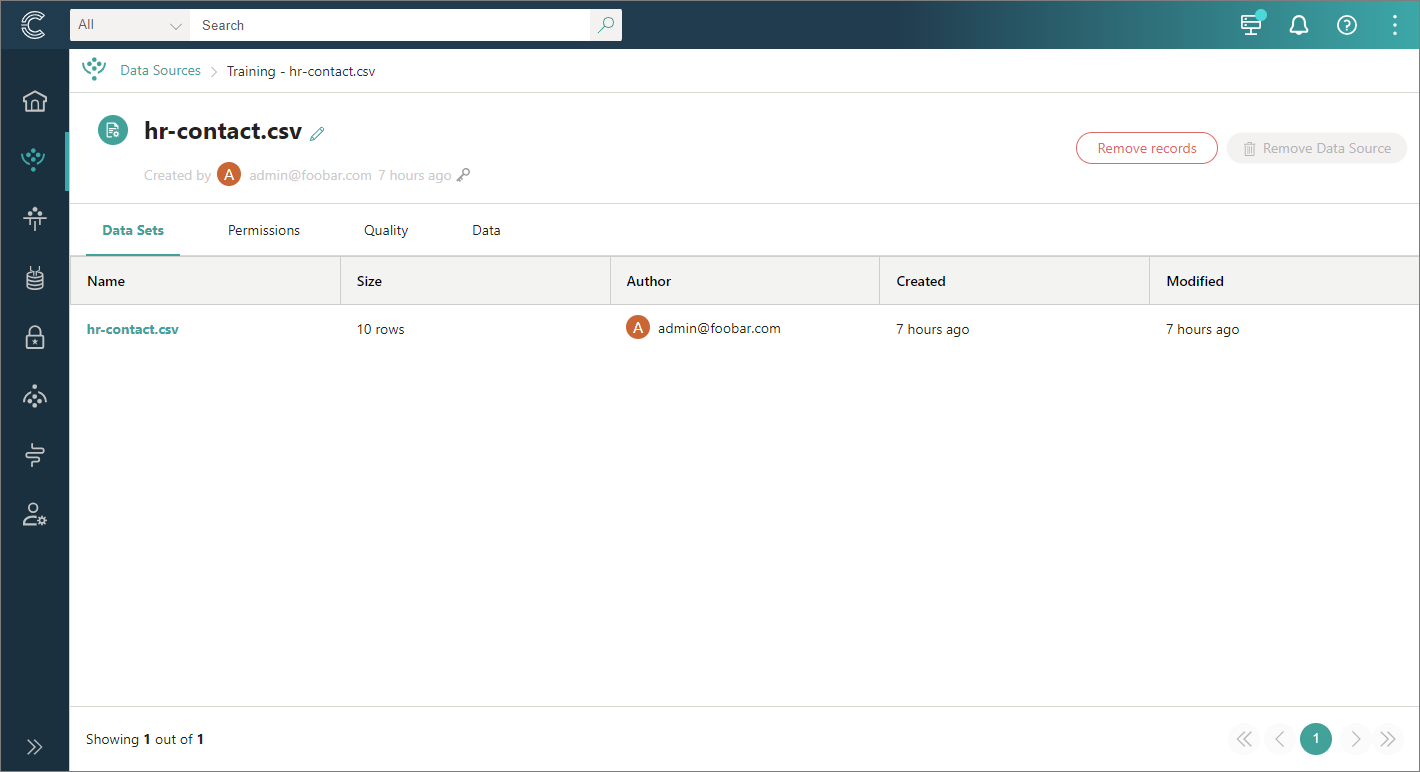
Data set containing raw records on the Preview tab
The main goal of data ingestion is to have some records on the Preview tab.
Next step
Ensure that the required records are available on the Preview tab of the data set. Once the necessary data is ingested, you can start the mapping process.