Processing pipeline
On this page
- Processing architecture
- Scaling
- Simple vs. complex data
- Monitoring the performance
- Configuring the pipelines
Conceptually, you can think of CluedIn as a streaming platform with multiple persistence stores. In addition, CluedIn ships with extensive functionality to integrate, manipulate, govern, and steward data on its way to downstream consumers.
With this in mind, the natural question arises: How long does it take to process data from input to output?
The answer depends on many factors, including:
-
The number of CPU cores assigned to processing.
-
The amount of RAM assigned to processing.
-
The complexity and size of the data.
-
Which CluedIn features are enabled in the processing pipeline (this article assumes all features are active).
Processing architecture
CluedIn uses an Enterprise Service Bus (ESB) to queue incoming data. This data is then monitored by multiple workers—in-memory .NET Core processes that:
-
Take one record at a time.
-
Run it through hundreds of validations, automated cleaners, and processors.
Because the ESB itself can process messages extremely quickly, the performance bottleneck often comes from the volume of validations and processors. For example:
-
Raw ESB rate: ~30,000 messages per second.
-
With full processing: ~1,000 messages per second.
The more the system automates, the slower it processes data.
Scaling
CluedIn scales vertically (bigger machines) and horizontally (more machines).
-
Processing components are stateless, so you can run anywhere from 0 to 100+ processing services.
-
While CluedIn can technically run on 1 CPU core, this is not optimal for production workloads.
-
CPU cores and RAM for processing services are configured in Helm charts.
-
Kubernetes Node Pools must also have sufficient resources to allow scaling.
Simple vs. complex data
In CluedIn, we typically distinguish between simple and complex data:
-
Simple data – Requires minimal built-in services, so it is processed faster.
Example: small, well-structured records such as table rows or JSON/XML from a REST API.
-
Complex data – Triggers many built-in processing functions, requiring more work.
Example: physical files, large records in tables, or large JSON/XML packages.
Consider carefully whether you need to ingest all columns from all tables. You can always bring in additional data later without complex remodeling.
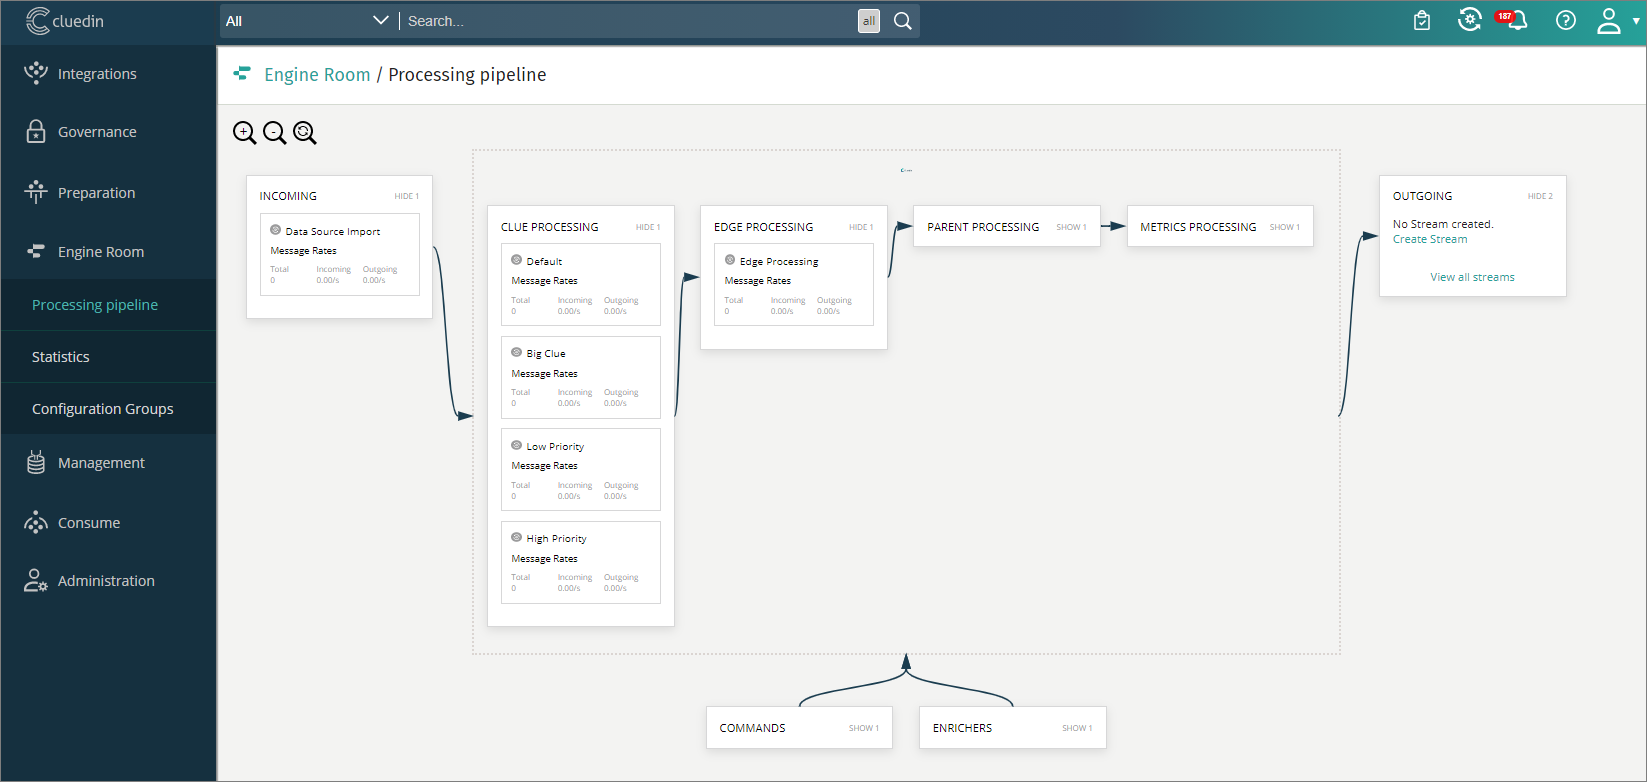
Monitoring the performance
CluedIn provides ways to monitor the processing pipeline’s performance. Administrators can use the Engine Room in the UI to:
-
View the overall speed of the processing pipeline.
-
Drill down into each processing step to see throughput rates.
Configuring the pipelines
You can selectively enable or disable certain processing pipelines. If you don’t need some of the more expensive steps, you can turn them off through configuration. This allows you to balance data quality against performance, depending on your requirements.