Preview
On this page
In this article, you will learn about various actions available on the Preview tab of the data set to help you analyze the uploaded records and improve their quality before processing.
When you upload the data into CluedIn, it appears on the Preview tab that displays the original, raw records. At this stage, you can perform various actions to identify data quality issues and prepare your data set for processing.
Search through source records
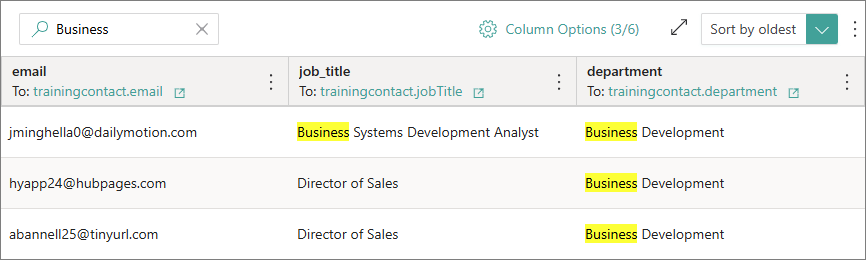
You can search through all source records to quickly locate and review particular records. Just enter a key word in the search box and start to search. As a result, all relevant records will be displayed on the page.
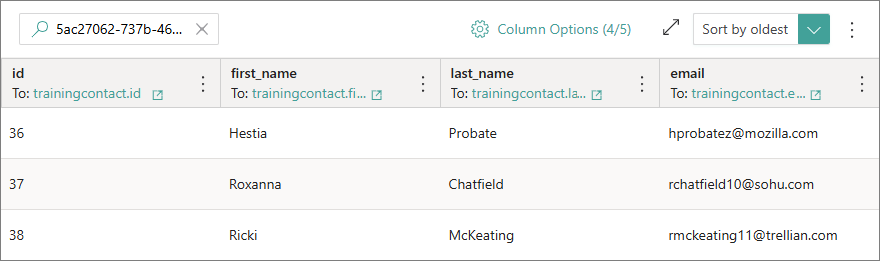
If you are working with a data set created from an ingestion endpoint, you can search for records from a specific request send to the endpoint. You can find and copy the request ID on the Monitoring tab, and then paste it to the search box on the Preview and start to search. As a result, all records that were sent to CluedIn in a specific request will be displayed on the page. For more information about the request ID, see Monitoring.
Analyze source records
Profiling allows you to analyze the uploaded records, identify issues and anomalies, and ensure data quality. By detecting inconsistencies and errors early, you can take corrective actions to improve the accuracy and reliability of your data.
On the Preview tab, there are two types of profiling:
Profiling for data set
Profiling for the data set allows you to analyze key metrics for each column of the uploaded records and identify data gaps, errors, and overall quality issues. By analyzing data set profiling, you can better understand the source records, evaluate their quality, and make informed decisions for mapping.
To view data set profiling
-
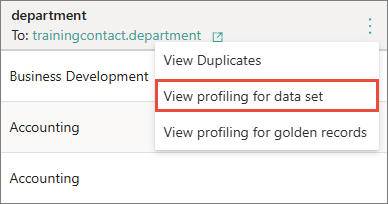
Find the column for which you want to view data set profiling. In the column header, open the three-dot menu, and then and select View profiling for data set.
The Key metrics pane opens, where you can view the details about column values.
The key data set profiling metrics include the following:
-
Number of values – the total number of source records that have a value in a given column.
-
Number of empty values – the total number of source records that have an empty value in a given column.
-
Completeness – the percentage of non-empty or non-null values in a given column.
-
Incompleteness – the percentage of empty or null values in a given column.
-
Cardinality – the number of unique values in a given column.
-
Redundancy – the number that represents the frequency with which unique values are repeated in a given column.
By analyzing data set profiling metrics, you can quickly identify if a particular column contains empty fields. Once aware of this issue, you can fix it by providing the necessary values as described in Modify source records. In general, a high percentage of incompleteness and a large number of repeated values may indicate that the field is not a good choice for producing identifiers.
Profiling for golden records
Profiling for golden records provides a breakdown and distribution of all vocabulary key values in a graphic format. It can help you identify issues and anomalies in data quality. Profiling is not limited to a data set, meaning that it displays information about vocabulary key values coming from different data sources.
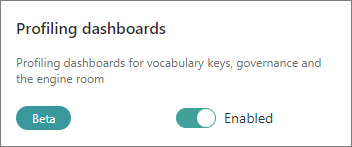
To access profiling for golden records, go to Administration > Feature Flags, and enable the Profiling dashboards feature.
To view profiling
-
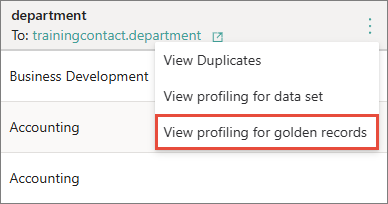
Find the column for which you want to view golden record profiling. In the column header, open the three-dot menu, and then and select View profiling for golden records.
The Profiling pane opens, where you can view the details about the vocabulary key values in a graphic format.
The main profiling details for golden records include the following:
-
Total values – the total number of values that the vocabulary key has in the system.
-
Values over time – a time-series visualization displaying the count of values that appeared in CluedIn over time. The x axis represents the time, and the y axis represents the count of values. For a more granular view, you can select a specific time period using the mouse.
-
Distribution of values (bar gauge) – the distribution of vocabulary key values based on the number of records where each value is used. Each bar represents a distinct value, with the color gradient indicating the frequency of that value’s occurrence in the records: green indicates a lower number of records, while red indicates a higher number of records. This gradient provides a quick visual cue for identifying the most and least common values.
-
Distribution of values (pie chart) – the distribution of vocabulary key values based on the number of records where each value is used. Each slice of the pie represents a distinct key value, with the area of the slice indicating the frequency of that value’s occurrence in the records. The larger the slice, the higher the number of records that contain the value. This type of visualization helps to quickly understand the relative proportions of different vocabulary key values.
You can view profiling for golden records at any stage of the data ingestion process: immediately after uploading the data, after creating the mapping, or after processing the data. Profiling is type-specific, so if you change the data type during mapping and then process the data, the profiling dashboard may look different from when you first uploaded the data. For example, if you change the data type for the Revenue column from text to integer, the profiling dashboard will display metrics such as minimum value, maximum value, and average value instead of a breakdown and distribution of text values. You can also view profiling on the vocabulary key page.
Duplicates
Once you have created the mapping for the data set, you can check if a specific column contains duplicate values.
To view duplicates
-
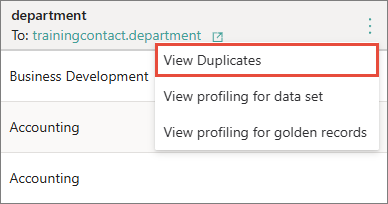
Find the column for which you want to view duplicates. In the column header, open the three-dot menu, and then and select View duplicates.
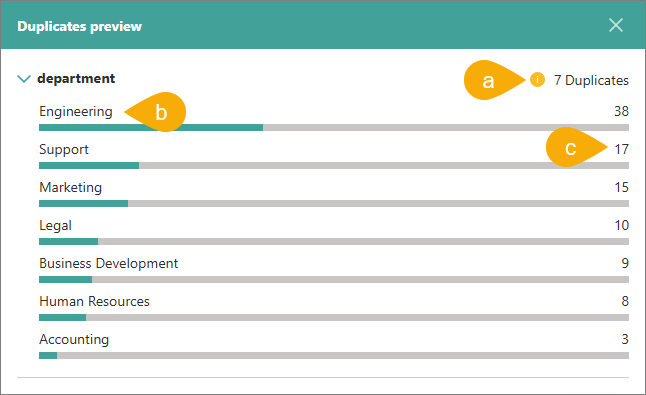
The Duplicates preview pane opens, where you can view the total number of duplicate values in the column (a), identify which values are duplicates (b), and see how many times each duplicate value occurs (c).
Modify source records
If you identify data gaps, errors, and overall quality issues in your source records and want to fix them before processing, you can do so in the edit mode of the data set. The edit mode allows you to perform various operations and validations on the source records to address these issues. The edit mode is available in data sets created from files and endpoints.
When you switch to the edit mode, the original data set is cloned, so you can revert back to it at any time. However, reverting to the original data set means losing all changes made in the edit mode.
To switch to the edit mode
-
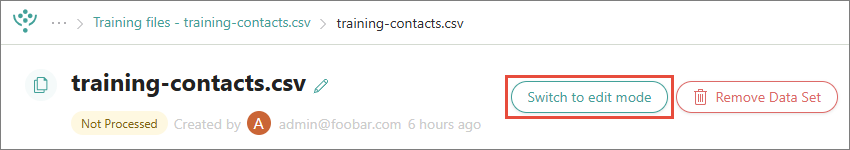
In the upper-right corner of the data set page, select Switch to edit mode.
-
Review the instructions about the edit mode, and then confirm that you want to switch to the edit mode.
Depending on the size of your data set, switching to the edit mode might take some time. You’ll receive a notification when the data set has been switched to the edit mode.
If you switch to edit mode for a data set that has already been processed, keep in mind that editing and re-processing this data set might lead to changes in primary identifiers. For example, if the primary identifiers are auto-generated, re-processing the data set will produce new golden records.
If you decide to go back to the original data set, exit the edit mode. To do that, in the upper-right corner of the data set page, select Switch to original. Then, confirm that you want to switch to the original data set. If you made any changes in the edit mode, they will not be available in the original data set.
When your data set is in the edit mode, you can do the following actions:
Filter records
Filters help you quickly find specific source records, identify records with empty values, and view column value aggregation. You can apply the following filters to any column:
-
Search – select or enter a specific value to search for all records containing that value. You can choose to display the results that precisely match the entered value (Precise match) or those that exclude it (Inverse).
-
Is empty – display all records where the column contains empty values.
-
Is not empty – display all records where the column does not contain empty values.
-
Aggregation – consolidate and summarize all values contained in the column.
-
Invalid fields – display all records that contain invalid fields according to column validation result. If no validation is applied to the column, this filtering option is unavailable. Learn more about validation in Source record validation.
-
Valid fields – display all records that contain valid fields according to column validation result. If no validation is applied to the column, this filtering option is unavailable. Learn more about validation in Source record validation.
You can use filters when you need to find incorrect or empty values. Once you find them, you can fix them by editing the values manually.
To apply a filter
-
Find the column you want to filter. In the column header, open the three-dot menu, select Filter, and then select the needed filtering option.
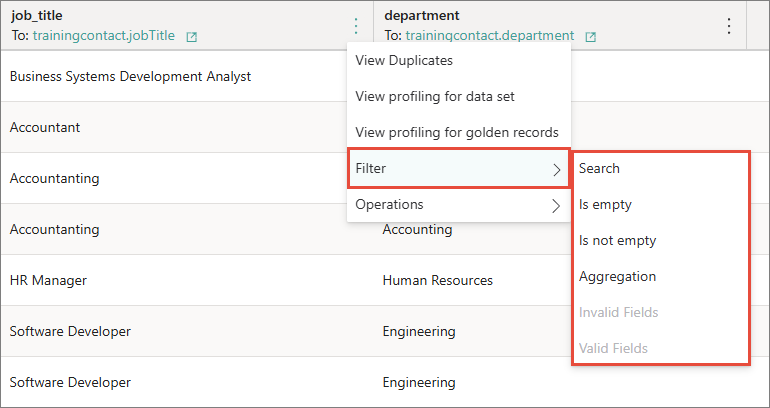
As a result, the records matching the filter are displayed on the page. All applied filters are listed on the Filters pane.
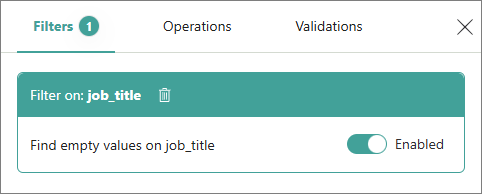
If you don’t need a filter temporarily, you can disable it and enable it again when needed. If you no longer need a filter, you can delete it by selecting the delete icon.
Edit values manually
If you notice that your source records contain invalid values, missing values, or other issues and want to fix them before processing, you can do it by modifying the values manually. This way, you can fix incorrect spelling, provide missing values, or make any other changes.
To edit a value manually
-
Find a record containing a value that you want to edit. To quickly find the needed record, use filters.
-
Click on the cell containing a value that you want to edit and make the needed changes. The edited value is formatted in bold.
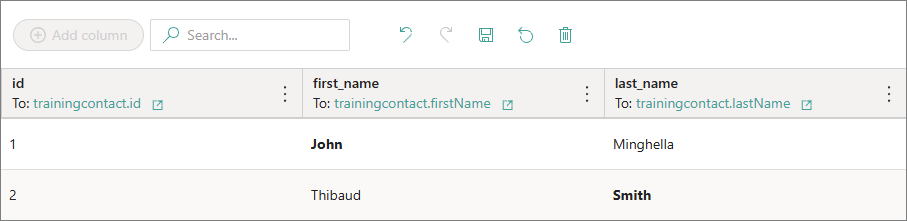
-
Select Save. The bold formatting of the changed value disappears.
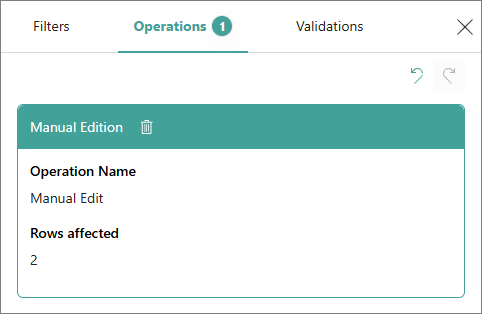
The history of your manual changes is displayed on the Operations tab.
If you no longer need the change or you made it by mistake, you can revert the change. To do it, select the delete icon next to the operation name or the revert icon in the upper-right corner. Note that changes can only be reverted consecutively, one by one, and not selectively.
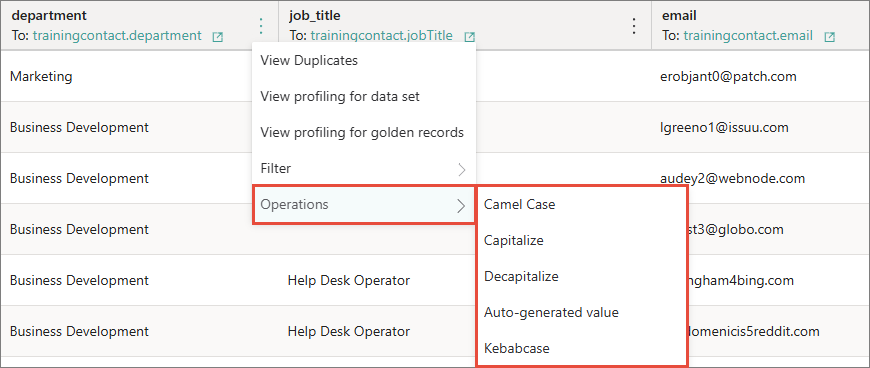
Transform values using operations
You can transform and improve the contents of columns automatically and efficiently using operations. For example, you can transform the values to upper case, remove extra spaces, replace one value with another, and more. The following table shows all available operations and their description.
| Operation | Description |
|---|---|
| Camel case | Transform all values in the column to camel case (directorOfSales). |
| Capitalize | Change the first letter of the first word to uppercase (Director of sales). |
| Decapitalize | Change the first letter of the first word to lowercase (director of sales). |
| Auto-generated value | Replace values with automatically created unique values. |
| Kebab case | Transform all values in the column to kebab case (director-of-sales). |
| Lower case | Transform all values in the column to lowercase (director of sales). |
| Set value | Replace all values in the column with the specified value. |
| Slugify | Convert a string into a lowercase, hyphen-separated version of the string, with all special characters removed. |
| Swap case | Invert the case of each letter in a string. This means that all uppercase letters are converted to lowercase, and all lowercase letters are converted to uppercase. |
| Trim | Remove all leading and trailing whitespace from a string. |
| Trim Left | Remove only the leading whitespace from a string. |
| Trim Right | Remove only the trailing whitespace from a string. |
| Upper case | Convert all letters of each word to uppercase (DIRECTOR OF SALES). |
| Title case | Convert the first letter of each word to uppercase (Director Of Sales). |
| Keep only numbers | Extract and retain only the numeric characters from a string, removing any non-numeric characters. |
| To Boolean | Convert a value to a Boolean data type, which can be either true or false. |
| Replace | Replace the first occurrence of a specified pattern within a string with another character or sequence of characters. |
| Replace all | Replace all occurrences of a specified pattern within a string with another character or sequence of characters. |
| Replace spaces | Replace spaces in a string with another character or sequence of characters. |
| Replace character(s) with space | Replace specified characters with a space. |
To transform values in a column using an operation
-
Find the column containing values that you want to transform. In the column header, open the three-dot menu, select Operations, and then select the needed operation.
As a result, the values in the column are automatically transformed. All applied operations are displayed on the Operations pane. If you no longer need the change or you made it by mistake, you can revert the change. To do it, select the delete icon next to the operation name or the revert icon in the upper-right corner. Note that changes can only be reverted consecutively, one by one, and not selectively.
Add columns
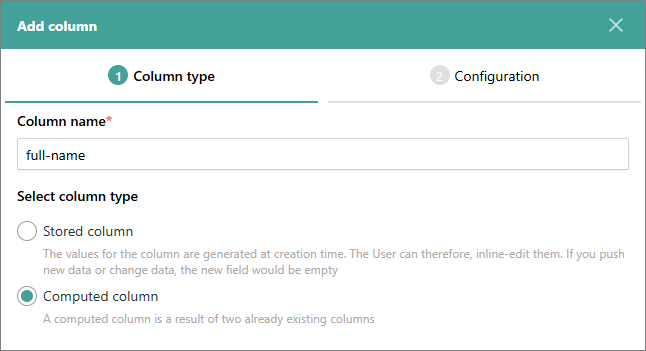
You can add new columns to your dataset. This is useful for combining values from other columns or creating an empty column for new values. There are two types of columns that you can add:
-
Stored column – the values are generated only at the column creation time. If new records appear in the data set afterwards, the stored column in such records will contain empty values. Stored column may be a good choice when working with a data set created from a file, which will not change over time.
-
Computed column – the values are combined from already existing columns into one new column. Computed column may be a good choice when working with a data set created from an endpoint, which will receive new records over time.
To add a column to the data set
-
Select Add column.
-
Enter the column name and select the column type.
-
Select Next.
-
Choose an option for generating the values for the column:
-
(Stored column) Empty – a new column with empty fields will be added to the data set.
-
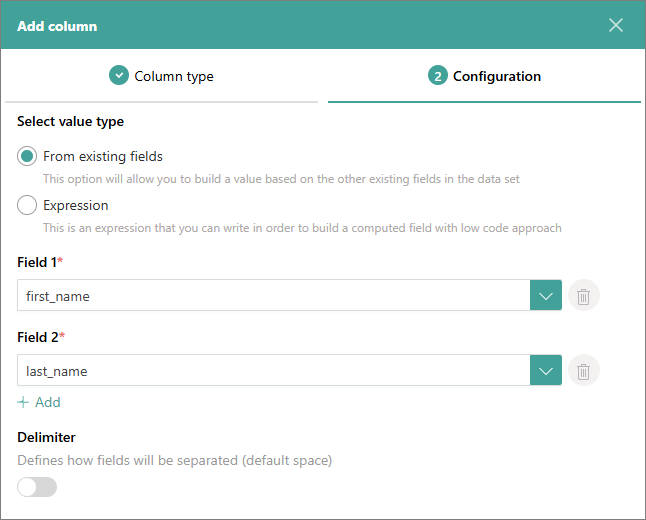
(Stored column or computed column) From existing fields – select the fields from the data set that you want to combine to create values for a new column. You can add multiple fields. By default, the values are separated with a space, but you can enter another delimiter if needed.
-
(Stored column or computed column) Expression – enter a C.E.L supported expression to create values for a new column.
-
-
Select Save.
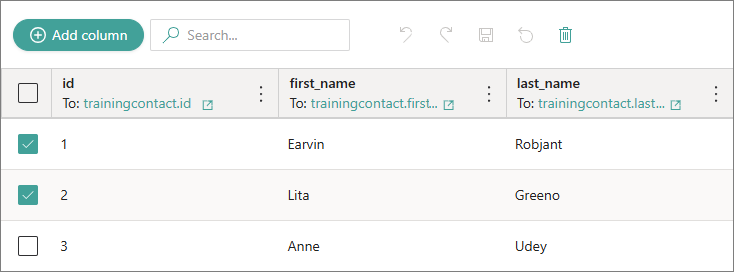
The new column is added to the data set and is marked with the information icon. If you no longer need the column, you can delete it. To delete the computed column, open the three-dot menu in the column header, select Delete computed field, and then confirm your choice. To delete the stored column, open the Operations pane, and then select the delete icon for the corresponding operation or the revert icon in the upper-right corner. Note that operations can only be reverted consecutively, one by one, and not selectively.
Remove source records
If you do not need specific source records, you can remove them from the data set.
To remove source records
-
Select the checkbox next to the source record that you want to remove.
-
Select the delete icon.
-
In the confirmation dialog, enter DELETE, and then select Confirm.
As a result, the records are removed from the data set. This change is displayed on the Operations tab. If you removed the records by mistake, you can revert the change. To do it, select the delete icon for the corresponding operation or the revert icon in the upper-right corner. Note that changes can only be reverted consecutively, one by one, and not selectively.
Additional actions
Apart from analyzing and modifying source records, you can perform additional actions on the Preview tab. These actions depend on the data source type.
File: Download original file
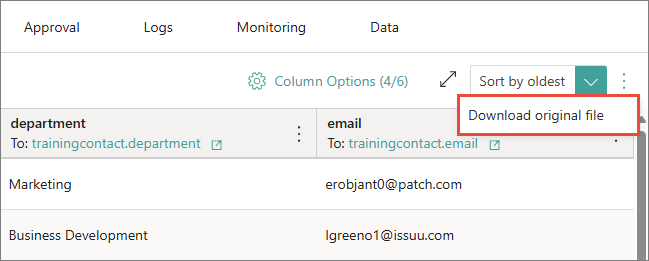
If you are working with a data set created from a file, you can download the original file. This is useful if you have modified the source records in the edit mode and want to keep the original file for reference.
To download the original file
-
Near the sorting dropdown list, open the three-dot menu, and then select Download original file.
As a result, the original file is downloaded to your computer.
Endpoint: Clear records
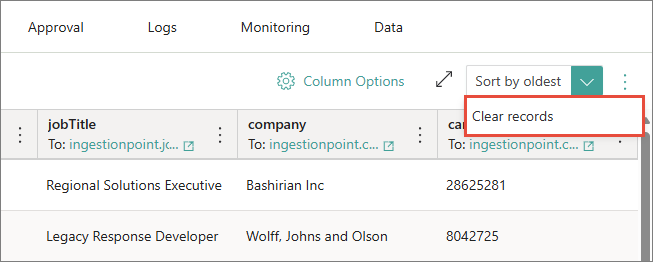
If you are working with a data set created from an endpoint, you can delete the records from temporary storage on the Preview tab. This is useful if you send many requests to the same endpoint and want to avoid processing each record every time. When processing records, CluedIn checks if they have been processed before. If they have, they won’t be processed again. To reduce processing time, you can delete already processed records from the Preview tab.
You can clear the records regardless of whether the records have been processed or not, but if you haven’t processed the records, they will be permanently deleted.
To clear records
-
Near the sorting dropdown list, open the three-dot menu, and then select Clear records.
-
In the confirmation dialog, enter DELETE, and then select Confirm.
As a result, all records from the Preview tab are deleted, and you can send more data to the endpoint.