Data Quality Metrics
Data Metrics will allow you to score and monitor the history of data quality over time. Data Metrics are aggregated on many different levels and you might find that you need to control how that aggregation is done at each level.
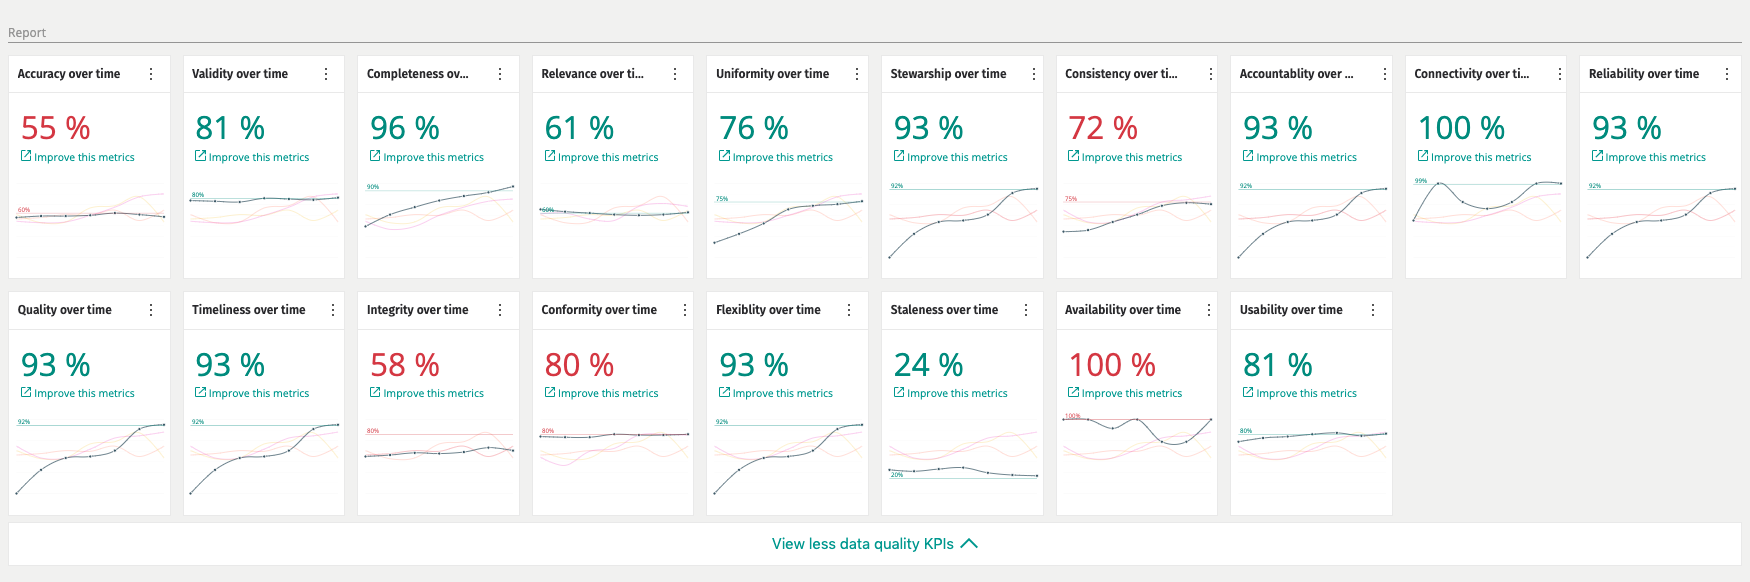
At the core of the Metrics are a way to calculate different types of scores given certain data values. This could be in the form of a percentage between 0 and 100, a simple integer or something more advanced. Most of the out of the box data metrics to do with Data Quality are in the form of a percentage between 0 and 100. To date, we support:
Accuracy Completeness Relevance Connectivity
To add new metrics, you will simply need to create a new C# class and inherit from Metric
There are other metrics, like Accuracy where we calculate down to the property history as we are wanting to measure how all permutations of a value correlate with each other. In some cases you might find that the parent levels of metrics are simply an average, mean or sum of the higher precision scores. In other cases you might find that you calculate a score differently at each level.
Here is an example of how the default Accuracy implementation is structured:
Accuracy
For all properties, how much are the same or similar in the property history. Use simple normalization to cater for more values. If you only have one value then accuracy is 50%. How to fix: Mesh to change the values in the source. CluedIn Clean: Reconciliation. Manual Edit. CluedIn Train: Questions in the form of “Is Martin’s best email msh@cluedin.com?”, Are these photos of the same person?
• Example of calculation
	○ Property level
	○ Property, integration type level
	○ Property integration level
	○ Entity integration type level
	○ Entity integration level
	○ Entity level
	○ Integration type level
	○ Integration level
	○ Global level
Property Level
• Entity
	○ Branch A (SharePoint, Integration 1)
		§ Version 1
			□ Property 1	Old Value
			□ Property 3	Value
		§ Version 2 (HEAD)
			□ Property 2	My Value

	○ Branch B (SharePoint, Integration 2)
		§ Version 1 (HEAD)
			□ Property 1	Latest Value
			□ Property 2	My Value

	○ Branch C (LDAP, Integration 3)
		§ Version 1 (HEAD)
			□ Property 2	My Old Value
			□ Property 3	Value

	○ Branch D (LDAP, Integration 4)
		§ Version 1 (HEAD)
			□ Property 3	Value


• Branch A Merged Record
	○ Property 1	Old Value
	○ Property 2	My Value
	○ Property 3	Value

• Branch B Merged Record
	○ Property 1	Latest Value
	○ Property 2	My Value

• Branch C Merged Record
	○ Property 2	My Old Value
	○ Property 3	Value

• Branch D Merged Record
	○ Property 3	Value
Property 1 Values from each branch merged records: “Old Value”, “Latest Value”, [Missing], [Missing] Unique Values: Value Count Count at Head Old Value 1 0 Latest Value 1 1 [Missing] 2 -
Number of branches: 4
Property 2 Values “My Value”, “My Value”, “My Old Value”, [Missing] Unique Values: Value Count Count at Head My Value 2 2 My Old Value 1 1 [Missing] 1 -
Property 3 Values “Value”, [Missing], “Value”, “Value” Unique Values: Value Count Count at Head Value 3 2
Formula: [Max Unique Value Count] / ([Sum of value counts] + ([Missing values] / [Branch Count]))
max Max Unique Value Count populated Sum of value counts / Count populated records missing Number of records with missing value branches Branch Count
Alternative
Min(1, ([Max Unique Value Count] + ([Count at head] / [Branch Count])) / ([Sum of value counts] + ([Missing values] / [Branch Count])) )
Property 1 1 / (2 + (2/4)) = 0,4
Min(1, (1 + (1 / 2)) / (2 + (2/4))) = 0,6
Property 2 2 / (3 + (1/4)) = 0,6154
Min(1, (2 + (2/4)) / (3 + (1/4))) = 0,7692
Property 3 3 / (3 + (1/4)) = 0,9231
Min(1, (3 + (2/4)) / (3 + (1/4))) = 1,00
Other Examples: Branches: 10
Max Populated Missing Result 1 10 0 0,1000 1 9 1 0,1099 1 8 2 0,1220 1 7 3 0,1370 1 6 4 0,1563 1 5 5 0,1818 1 4 6 0,2174 1 3 7 0,2703 1 2 8 0,3571 1 1 9 0,5263 2 10 0 0,2000 2 9 1 0,2198 2 8 2 0,2439 2 7 3 0,2740 2 6 4 0,3125 2 5 5 0,3636 2 4 6 0,4348 2 3 7 0,5405 2 2 8 0,7143 3 10 0 0,3000 3 9 1 0,3297 3 8 2 0,3659 3 7 3 0,4110 3 6 4 0,4688 3 5 5 0,5455 3 4 6 0,6522 3 3 7 0,8108 4 10 0 0,4000 4 9 1 0,4396 4 8 2 0,4878 4 7 3 0,5479 4 6 4 0,6250 4 5 5 0,7273 4 4 6 0,8696 5 10 0 0,5000 5 9 1 0,5495 5 8 2 0,6098 5 7 3 0,6849 5 6 4 0,7813 5 5 5 0,9091 6 10 0 0,6000 6 9 1 0,6593 6 8 2 0,7317 6 7 3 0,8219 6 6 4 0,9375 7 10 0 0,7000 7 9 1 0,7692 7 8 2 0,8537 7 7 3 0,9589 8 10 0 0,8000 8 9 1 0,8791 8 8 2 0,9756 9 10 0 0,9000 9 9 1 0,9890 10 10 0 1,0000
Property integration type level
Filter the version branches down to integration type
• Branch A (SharePoint) Merged Record
	○ Property 1	Old Value
	○ Property 2	My Value
	○ Property 3	Value

• Branch B (SharePoint) Merged Record
	○ Property 1	Latest Value
	○ Property 2	My Value

• Branch C (LDAP) Merged Record
	○ Property 2	My Old Value
	○ Property 3	Value

• Branch D (LDAP) Merged Record
	○ Property 3	Value
SharePoint Property 1 Values “Old Value”, “Latest Value” Unique Values: Value Count Count at Head Old Value 1 0 Latest Value 1 1
1 / (2 + (0/2)) = 0,5

Min(1, (1 + (1/2)) / (2 + (0/2)) ) = 0,75
SharePoint Property 2 Values “My Value”, “My Value” Unique Values: Value Count Count at Head My Value 2 2
2 / (2 + (0/2)) = 1

Min(1, (2 + (2/2)) / (2 + (0/2)) ) = 1
SharePoint Property 3 Values “Value”, [Missing] Unique Values: Value Count Count at Head Value 1 0 [Missing] 0 -
1 / (1 + (1/2)) = 0,6667

Min(1, (1 + (0/1)) / (1 + (1/2)) ) = 0,6667
Ldap Property 2 Values “My Old Value”, [Missing] Unique Values: Value Count Count at Head My Old Value 1 1 [Missing] 1 -
1 / (1 + (1/2)) = 0,6667

Min(1, (1 + (0/1)) / (1 + (1/2)) ) = 0,6667
Ldap Property 3 Values “Value”, “Value” Unique Values: Value Count Count at Head Value 2 2
2 / (2 + (0/2)) = 1

Min(1, (2 + (2/2)) / (2 + (0/2)) ) = 1
Property integration level
Evaluate all branch versions match the integration
• Branch A (SharePoint, Integration 1)
	○ Version 1
		§ Property 1	Old Value
		§ Property 3	Value
	○ Version 2 (HEAD)
		§ Property 2	My Value
Integration 1 Property 1 Values “Old Value” Unique Values: Value Count Count at Head Old Value 1 0 [Missing] 1 -
	1 / (1 + (1/2)) = 0,6667

	Min(1, (1 + (0/2)) / (1 + (1/2)) ) = 0,6667

Property 2
	Values [Missing], "My Value"
	Unique Values:
		Value	Count	Count at Head
		My Value	1	1
		[Missing]	1	-

	1 / (1 + (1/2)) = 0,6667

	(1 + (1/2)) / (1 + (1/2)) = 1

Property 3
	Values "Value", [Missing]
	Unique Values:
		Value	Count	Count at Head
		Value	1	0
		[Missing]	1	-

	1 / (1 + (1/2)) = 0,6667

	(1 + (0/2)) / (1 + (1/2)) = 0,6667
Integration 2 Property 1 Property 2
Integration 3 Property 2 Property 3
Integration 4 Property 3
Why do my records show “Not enough data to show trend”?
This is due to the fact that since the first metric for this record and for this specific metric (e.g. Completeness), the value of this score has not changed and hence CluedIn will not record this as a new value.
This is partially due to the fact that these metrics can take up quite a lot of storage when run over huge amounts of data.