Common upgrade operations
On this page
This section outlines common CluedIn activities you may need to carry out during the CluedIn upgrade process. It is designed to provide practical steps and references that help you keep your CluedIn environment running smoothly.
Check CluedIn UI
A successful load of the CluedIn UI is a strong indication that your installation is functioning correctly.
To check CluedIn UI
-
To access the UI, use the URL that was configured during installation. Contact your administrator to get the URL. This URL may be either public or private:
-
Public URL – Accessible from any network without restrictions.
-
Private URL – Requires that you are connected to the correct internal or VPN network. Make sure you have the necessary access before attempting to open the UI.
-
-
Ensure you have access to CluedIn. Users can be granted access to CluedIn in two main ways:
-
Single sign-on (SSO) – Access is provisioned by your administrator through your organization’s SSO provider.
-
Invitation email – Your CluedIn administrator sends you an email invitation to join.
-
-
Check the UI:
-
Sign in to CluedIn. The home dashboard should appear almost instantly.
-
Click through the left-hand menu. All pages should appear almost instantly.
-
Perform a search in the top menu, click on any of the entities in the results, and then browse through the entity tabs. All tabs should respond quickly.
If any page takes longer than 5 seconds to load, it may indicate a performance issue or that the upgrade has not fully completed.
-
Check CluedIn pods
Monitoring the state of pods is a routine task in Kubernetes, and it is especially critical during installation and upgrades. Verifying that pods are running and healthy ensures that the CluedIn platform is functioning correctly and that new deployments are stable.
To check CluedIn pods
-
Before checking the pods, make sure you are already connected to the target Kubernetes cluster via a valid kubeconfig file. Without this connection, you will not be able to query the cluster.
-
To view the status of all CluedIn pods, run the following command:
kubectl get pods -n cluedinThe command returns the list of all pods in the CluedIn namespace (
-n cluedin) along with their current state (for example, Running, Pending, CrashLoopBackOff, Completed, Succeeded, or Failed). This provides quick visibility into whether services are healthy or require troubleshooting. Ideally, all pods should be in a Running or Completed state. -
Depending on what you see, do the following:
-
All pods in Running or Completed state. This indicates that your CluedIn installation is healthy and the infrastructure is actively running.
If all pods are Green/Running but the application still has issues, check the pod logs. For details, see the Check CluedIn logs section.
-
Pods in Pending state. If some pods remain in the Pending state, allow a few minutes for them to transition to Running. If a pod is still pending after 5 minutes, review the logs to identify the cause.
-
Pods in CrashLoopBackOff state. When a pod is in the CrashLoopBackOff state, it means Kubernetes is repeatedly trying to start the pod, but the container inside it keeps failing and crashing. After each crash, Kubernetes waits a little longer before attempting to restart it again (the “backoff” part).
Common causes:
-
Configuration errors – Such as incorrect environment variables, secrets, or config maps.
CluedIn config maps are complex. If changes have been made to the recommended configurations, revert them to the default settings.
-
Application errors – The application may crash on startup due to bugs, missing dependencies, or incompatible versions.
-
Resource limits (most common) – The container may not have sufficient CPU or memory and is killed by the system.
-
Permission or connectivity issues – For example, firewall changes or Azure policies may block the pod from starting.
-
-
-
To get more details about a pod that is not starting or is stuck in a crash loop, run the following command:
kubectl describe pod <pod-name> -n cluedin
Check CluedIn logs
All CluedIn pods generate logs that provide detailed information about what the system is doing. These logs help you do the following:
-
Confirm that services are running smoothly.
-
Diagnose issues when problems occur.
-
Gain visibility into the internal behavior of the system.
Reviewing pod logs is an essential step in troubleshooting errors and verifying that your installation is functioning correctly. Pod logs are especially useful for troubleshooting in the following scenarios:
-
CrashLoopBackOff – A pod repeatedly fails to start.
-
Running but Not Ready – Readiness probes fail even though the pod is running.
-
Running and Ready, but Application Misbehaving – The pod looks healthy but the application itself is not functioning correctly.
-
Init Containers Delayed or Failing – The initialization steps take too long or do not complete successfully.
To check the logs of a pod
-
Run the following command:
kubectl logs <pod name> -n cluedinLogs stored in a Kubernetes pod are limited to the default 10 MB size. If logs grow beyond this limit, older entries will no longer be visible when using kubectl logs. If you have log analytics configured to collect pod logs, it is recommended to use that to read the pod logs.
Check CluedIn queues
CluedIn queues are powered by a messaging system called RabbitMQ. RabbitMQ is a message broker – it allows different parts of CluedIn to communicate by passing messages between them:
-
Think of a queue as a waiting line for messages.
-
One service in CluedIn places messages onto the queue.
-
Another service takes messages off the queue and processes them.
This setup helps CluedIn handle large volumes of data reliably and asynchronously. By checking the queues, you can quickly determine if CluedIn’s internal messaging system is healthy, or if a backlog or failure might be affecting the platform.
Why are queues important?
If queues stop working correctly, CluedIn may not be able to move data between services efficiently. Common symptoms include:
-
Queues growing indefinitely (messages are piling up but not being processed).
-
Queues stuck (no new messages are being consumed).
Services that depend on these messages may experience failures or degraded performance.
To check the queues
-
Accesing RabbitMQ. Run the following command to get access the RabbitMQ credentials.
kubectl get secret cluedin-rabbitmq -n cluedin -o jsonpath="{.data.rabbitmq-password}" | base64 --decode -
RabbitMQ includes a built-in management UI. To access it, you first need to open a port forward to the RabbitMQ pod:
#kubectl port-forward service/cluedin-rabbitmq 15672:15672 -n cluedinThis will return an output similar to the following:
 Forwarding from 127.0.0.1:15672 -> 15672
 Handling connection for 15672
 Handling connection for 15672
 Handling connection for 15672
 Handling connection for 15672
 Handling connection for 15672
 Handling connection for 15672
The RabbitMQ dashboard becomes available at http://localhost:15672.
-
Sign in to the RabbitMQ UI using the following credentials:
-
Username – cluedin.
-
Password – Retrieve the password from your stored CluedIn credentials.
-
-
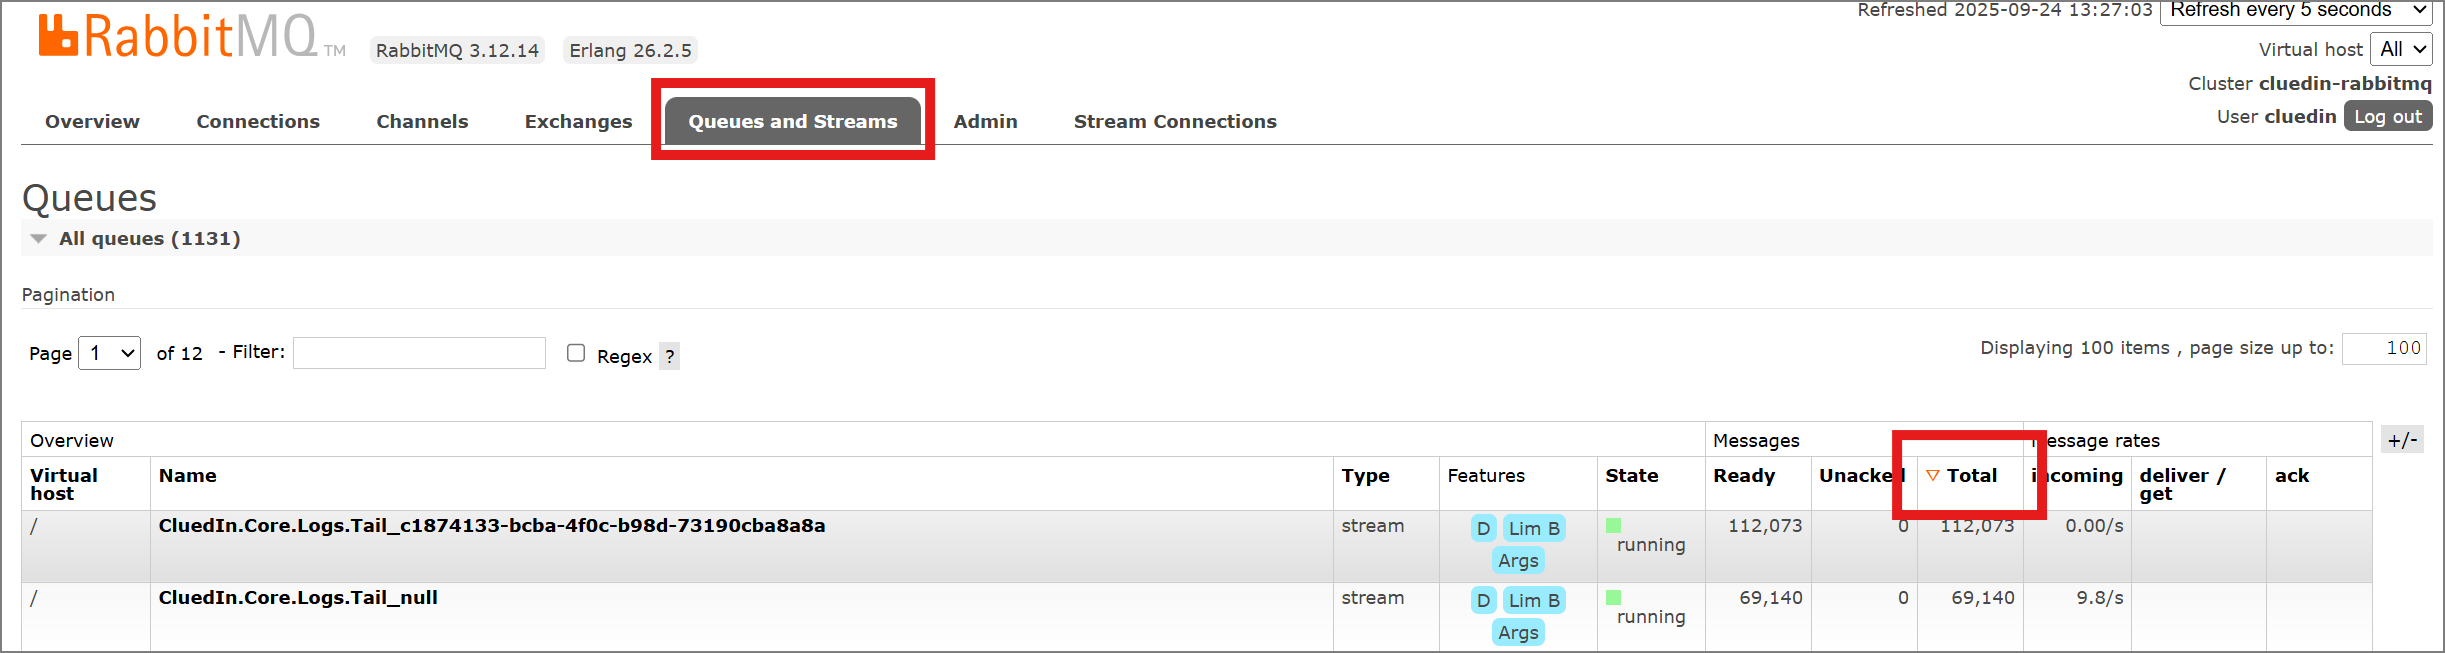
Check the queues. After the sign-in, the system typically directs you to the Overview tab. This dashboard provides a high-level summary of RabbitMQ, including the total number of messages currently in the system and key metrics related to queue activity.
-
You can sort the queues by total messages to quickly identify the largest queues within RabbitMQ.
-
You can also review message rates to determine whether queues are processing the messages as expected:
-
Incoming – Indicates that messages are being published to the queue by a producer. These messages remain in the queue until they are consumed.
-
Deliver/Get – Indicates that messages from the queue are being consumed by a consumer.
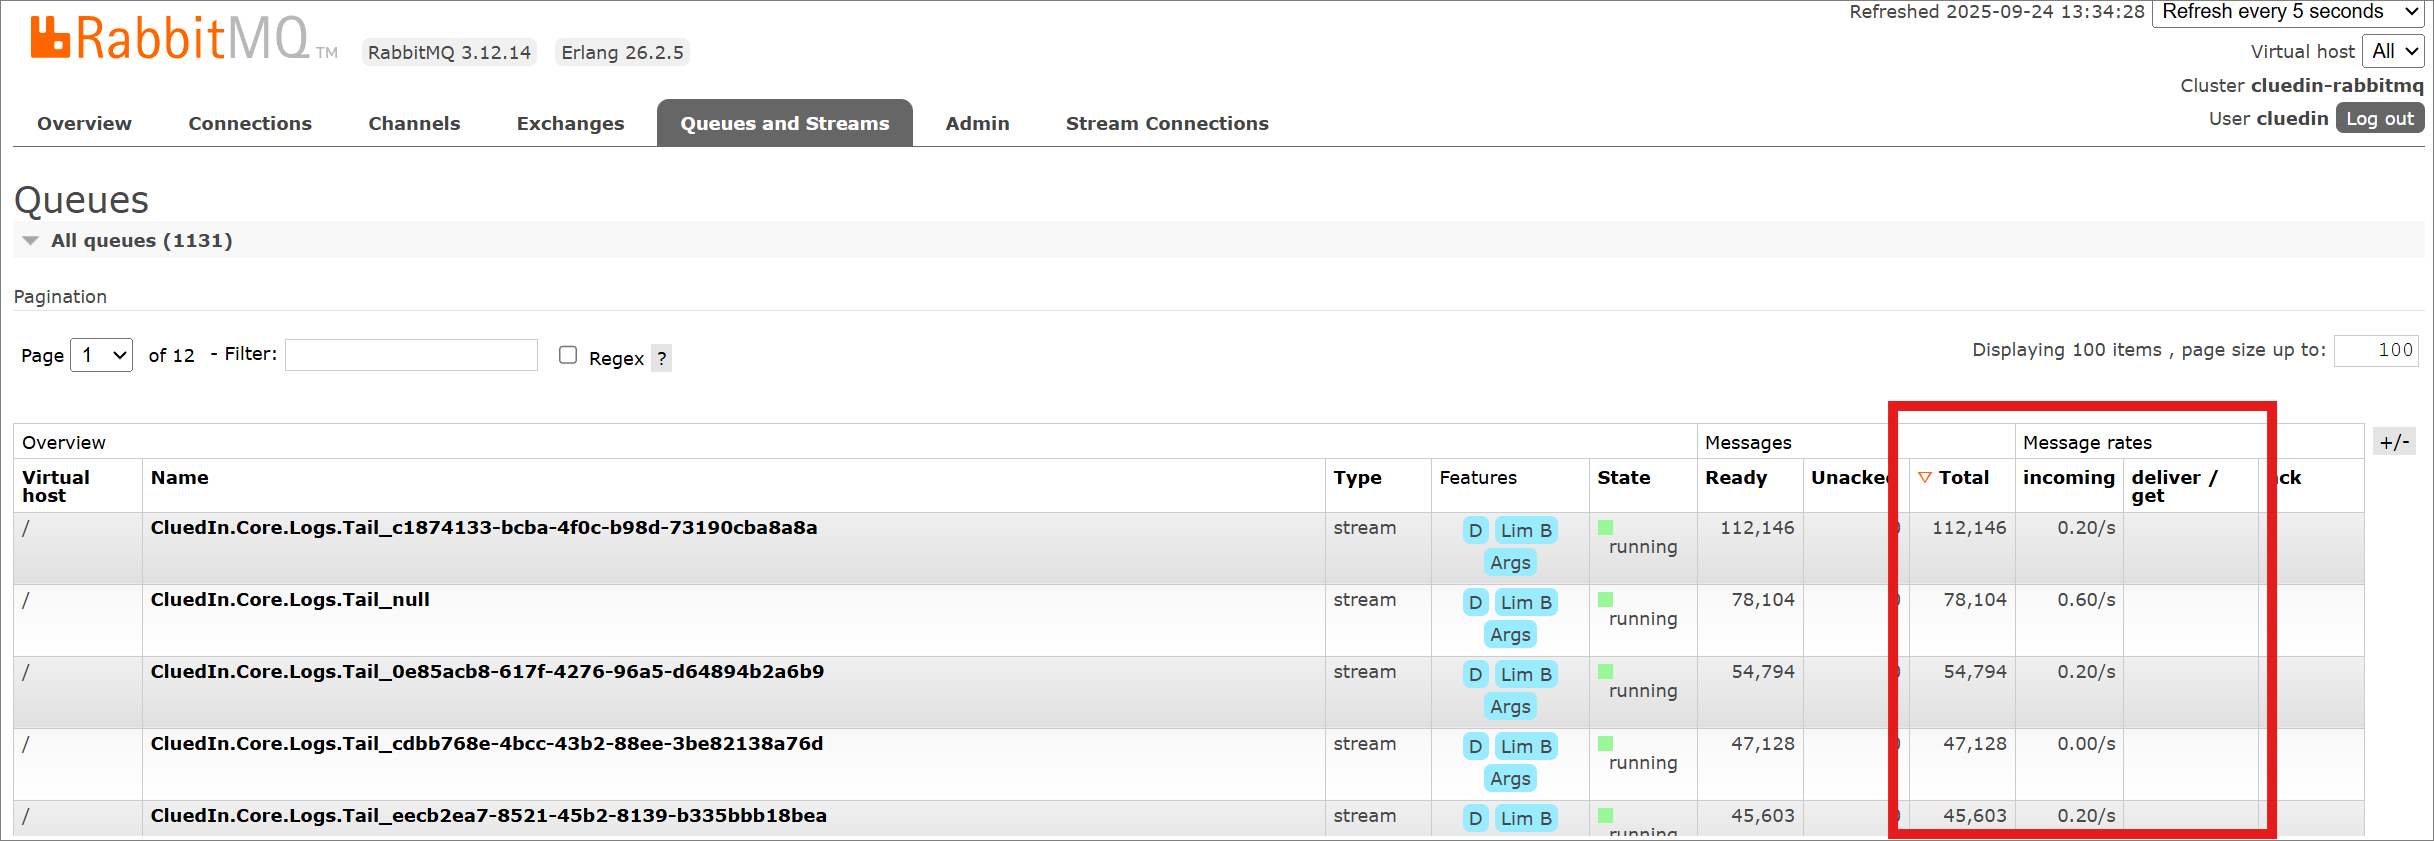
If you see a large number of Incoming messages but no corresponding Deliver/Get activity, it may indicate that no consumers are currently available to process those messages.
-
-
To check the number of consumers attached to a queue, click the +/– icon on the right-hand side to display the Consumers column.
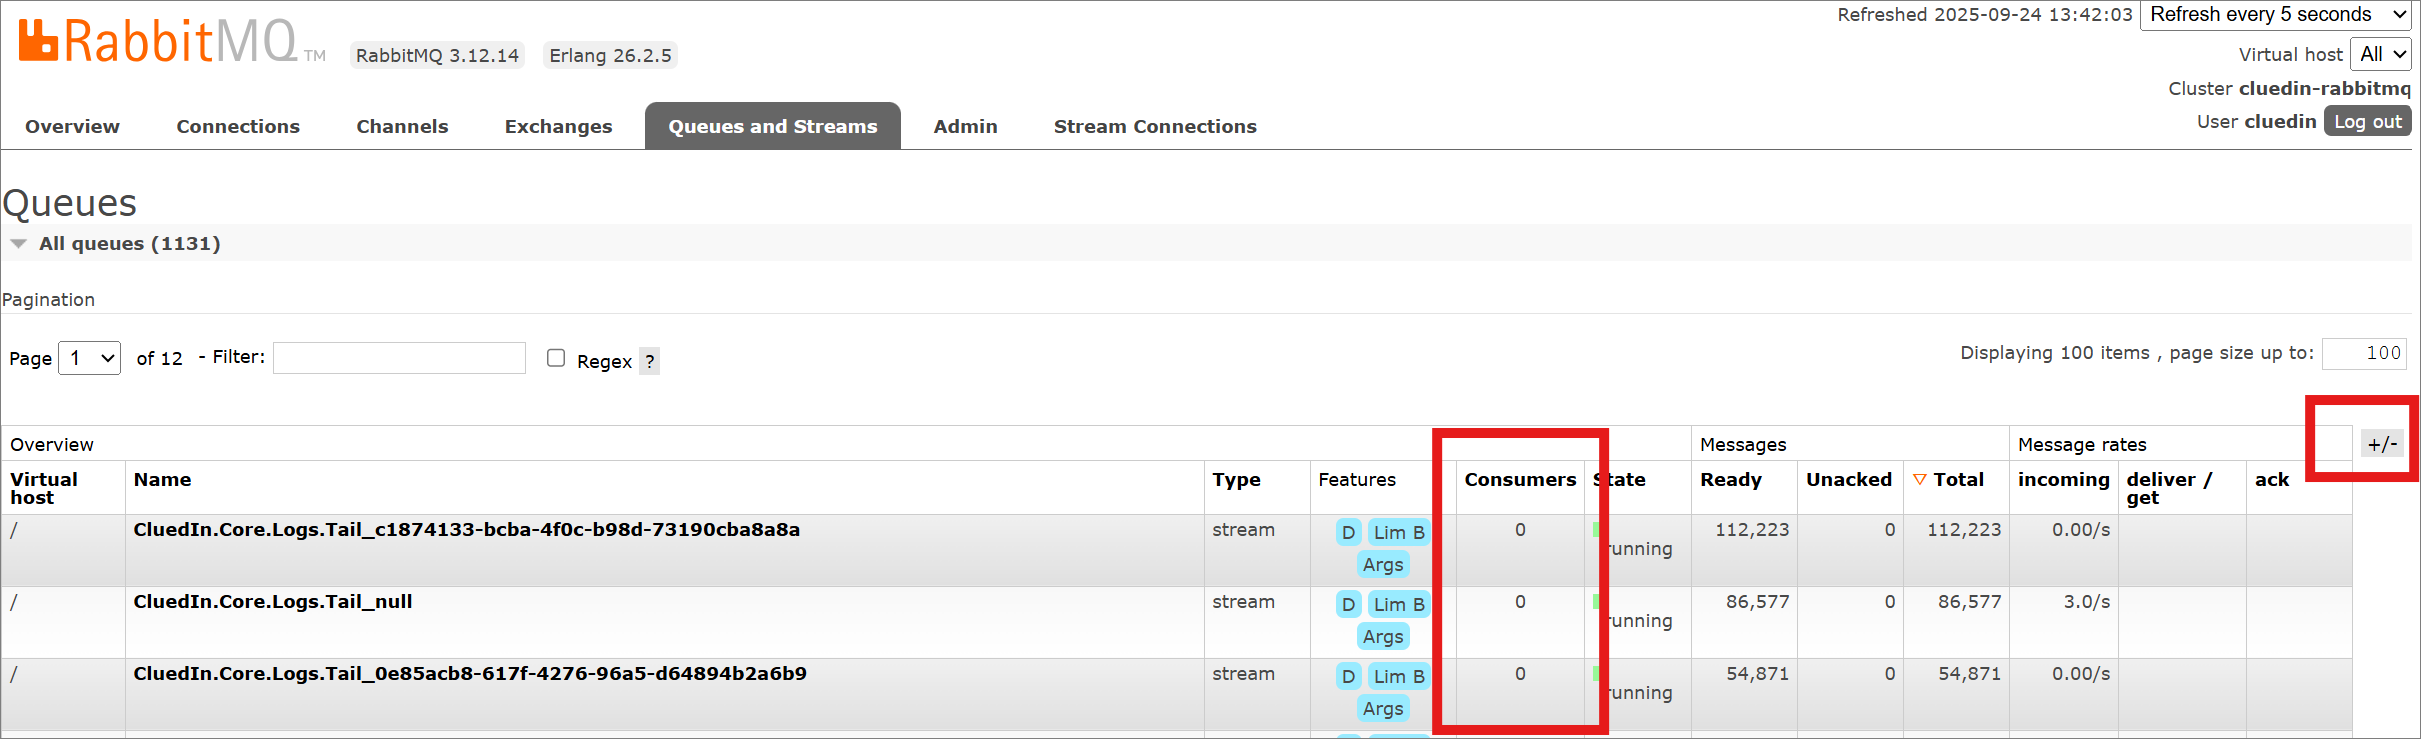
In the example above, the queue RemoteEvents_cluedin-server-processing is connected to a single consumer, with messages delivered at a rate of 224/s. This indicates that the queue is healthy and functioning as expected.
-